Increasingly A Safety Concern as Coal Plants Cycle It is well known that conventional coal-fired…
Metallurgical Lab Case Study: Contaminant Identification
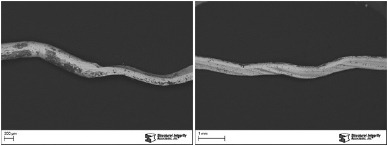
A small metallic particle that had contaminated a product line was brought to SI’s Materials Laboratory for analysis. The goal of the analysis was to identify the particle’s composition to help identify its original source. The particle was examined and documented in a scanning electron microscope (SEM) as shown in Figure 1. The particle was several millimeters long and appeared to have been originally round in cross-section with subsequent mechanical deformation. The particle exhibited intermittent areas of a surface deposits that appeared black in the SEM images.
An area that was relatively free of the surface deposit was analyzed using energy dispersive X-ray spectroscopy (EDS) to identify the element present in the base material. The EDS analysis are provided in the table. The particle was attached to an aluminum planchet with a piece of carbon tape, so much of the carbon is from the sample preparation. The EDS results indicated the particle was essentially an iron-based metal with approximately 18% chromium and 8% nickel, which is consistent with Type 304 stainless steel. Knowing the composition, the manufacturer is investigating possible sources.
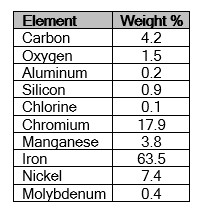
EDS provides qualitative elemental analysis of materials based on the characteristic energies of X-rays produced by the SEM electron beam striking the sample. Using a light element detector, EDS can identify elements with atomic number 5 (boron) and above. Elements with atomic number 13 (aluminum) and higher can be detected at concentrations as low as 0.2 weight percent; lighter elements are detectable at somewhat higher concentrations. As performed in this examination, EDS cannot detect the elements with atomic numbers less than 5 (beryllium, lithium, helium or hydrogen). The relative concentrations of the identified elements were determined using semiquantitative, standardless quantification (SQ) software. The results of this analysis are semi-quantitative and indicate relative amounts of the elemental constituents.
Related Posts